Falling With Style - Motion Lab
Objectives:
TI-84 Calculator-Based Lab Unit (CBL-II)
Motion detector
Meter stick
Computer with LoggerPro software
Procedure:
Part I –
1. Develop a position vs. time story that describes a body in motion incorporating at least the following four types of motion.
i. standing still
ii. moving with constant velocity
iii. moving with variable negative velocity
iv. moving with variable positive velocity
2. Illustrate the story on a position vs. time graph. Use a legend to cross reference sections of the graph with the corresponding sections of the story.
3. Underneath the graph, write instructions for moving in front of the motion detector according to the graph you have drawn.
Part II –
4. Measure out and mark meaningful locations on the floor and practice the motion needed to create the position vs. time graph.
5. Now it’s time for you to match your physical motion to your group’s descriptive motion graph. You have 3 attempts to match it as best you can. Save a copy best graph your motion creates and reproduce this graph using LoggerPro.
- Create a Displacement vs. Time graph and match your graph with actual motion.
- Gain competence in the use of motion detector and related equipment.
- Understand the relationship between position vs. time, velocity and acceleration.
TI-84 Calculator-Based Lab Unit (CBL-II)
Motion detector
Meter stick
Computer with LoggerPro software
Procedure:
Part I –
1. Develop a position vs. time story that describes a body in motion incorporating at least the following four types of motion.
i. standing still
ii. moving with constant velocity
iii. moving with variable negative velocity
iv. moving with variable positive velocity
2. Illustrate the story on a position vs. time graph. Use a legend to cross reference sections of the graph with the corresponding sections of the story.
3. Underneath the graph, write instructions for moving in front of the motion detector according to the graph you have drawn.
Part II –
4. Measure out and mark meaningful locations on the floor and practice the motion needed to create the position vs. time graph.
5. Now it’s time for you to match your physical motion to your group’s descriptive motion graph. You have 3 attempts to match it as best you can. Save a copy best graph your motion creates and reproduce this graph using LoggerPro.
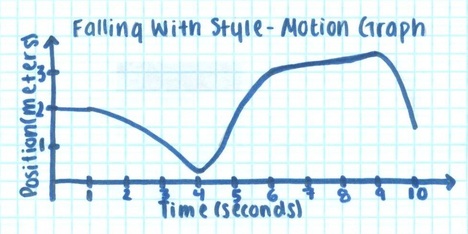
Buzz Lightyear's 'Falling With Style'
Buzz Lightyear still believes he is a real space ranger so Woody asks him fly. Buzz accepts the challenge. He creates a dramatic moment by standing on top of Andy's 2 meter high desk for 2 seconds and popping his wings out. He then jump onto a hot wheel and rides down the ramp for 3 seconds. It reaches it's minimum point at .25 meters. He then flies through the air for 2 seconds to a height of 3 meters. At this height, he grabs onto a zip line that is angled up so he will reach a maximum height of 3.5 meters in 3 seconds. Finally he grabs onto one of the army men's parachute and falls with style for 1 second onto the bed at 1.5 meters.
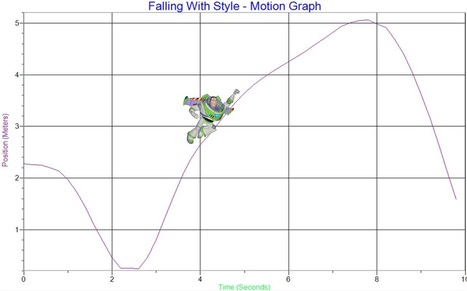
How We Recreated 'Falling With Style'
1. To recreated the 2 second dramatic pause, we stood still in front of the motion detector for 1 second, 1 meter away from the sensor. We recorded our graph using one half of our original values to make the motion detector application more manageable.
2. We then ran toward from the detector for 1.5 seconds.
3. To represent Buzz's flying through the air, we ran away from the detector with a positive variable velocity for 1 second.
4. We then continued walking backward at a constant velocity for 1.5 seconds.
5. Finally, we ran back toward the detector for .5 seconds.
Data Analysis
Our descriptive graph and motion detector graphs are very similar. The motion detector graph does not display the constant positive velocity as well at the descriptive graph. This occurs because of the challenge required to more a constant velocity in a negative direction away from the detector. Also, the concave down curve that occurs when Buzz flies through the air is not as smooth as the descriptive graph. It occurs because of the jerky movement when running away from the sensor. Also, the detector graph tends to have a higher height than intended because it is hard to measure the length away from detector without a physical measurement.
Conclusion
Through the use of Buzz Lightyear, we have discovered the representation and analysis of motion. It allowed us to compare applied and theoretical motion and create a position versus time graph for both. We learned that creating an exact representation of a theoretical motion graph using the motion detector is much harder than expected because of the many errors than can occur. It also showed that changing from a variable velocity into a constant velocity results in a curved graph rather that a concave down curve instantly into a straight line with positive slope. We also have a better understanding of how velocity aligns itself with respect to a position vs time graph. Finally, we understand all the concept of the graphical analysis better because we could physically create the motion rather than theoretically think of it.
